Google Sheets, like most spreadsheet apps, has a bunch of built-in formulas for accomplishing a number of statistical and data manipulation tasks. You can also combine formulas to create more powerful calculations and string tasks together. If you're already accustomed to crunching numbers in Excel, the exact same formulas work in Google Sheets most of the time.
For this tutorial, we'll focus on the five most common formulas, which are shown in the formula dropdown menu from the top navigation.
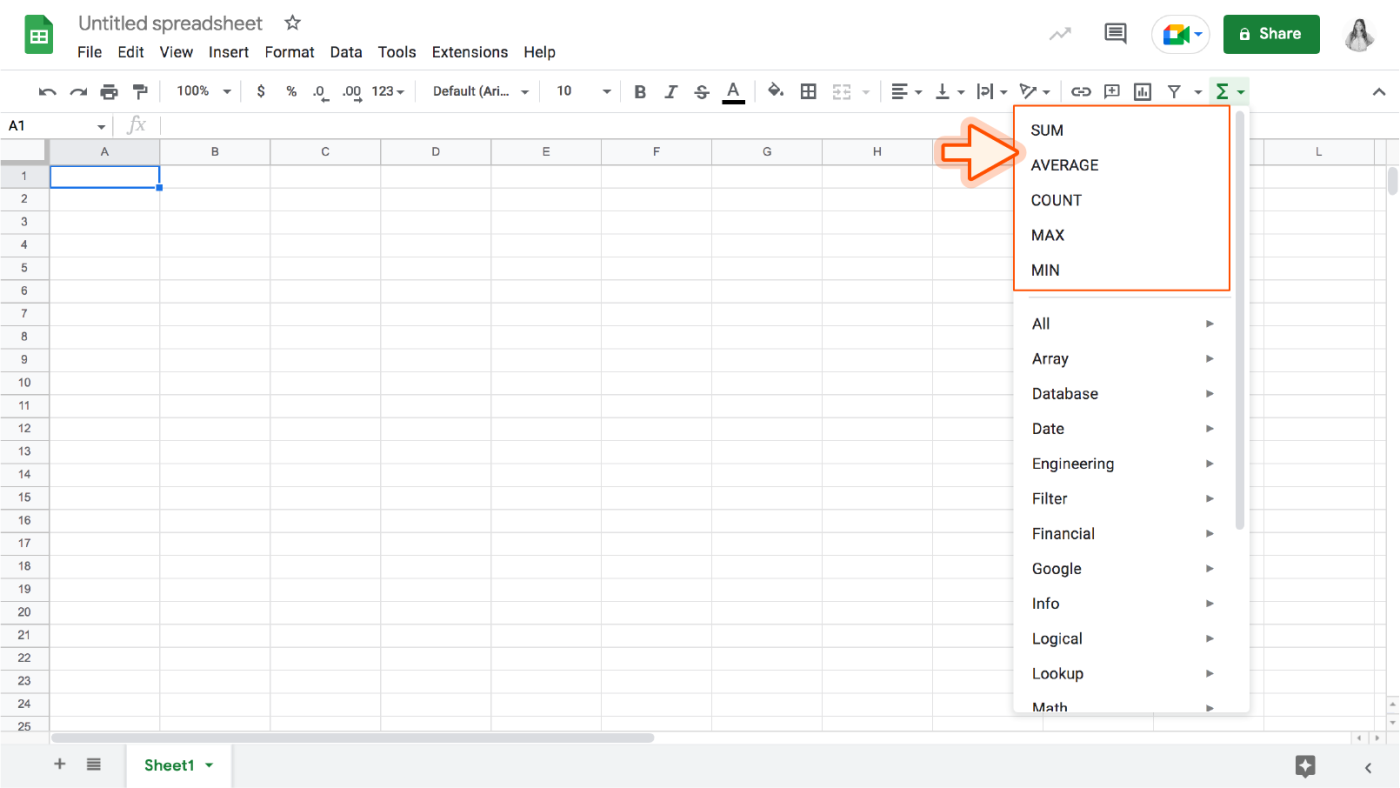
You can click a formula to add it to a cell, or you can start typing any formula with an equal (=) sign in a cell, followed by the formula's name. Sheets will autofill or suggest formulas based on what you type, so you don't need to remember every formula.
The most basic formulas in Sheets include:
SUM: adds up a range of cells (e.g., 1+2+3+4+5 = sum of 15)
AVERAGE: finds the average of a range of cells (e.g., 1, 2, 3, 4, 5 = average of 3)
COUNT: counts the values in a range of cells (e.g., 1, blank, 3, 4, 5 = 4 total cells with values)
MAX: finds the highest value in a range of cells (e.g., 1, 2, 3, 4, 5 = 5 is the highest)
MIN: finds the lowest value in a range of cells (e.g., 1,2,3,4,5 = 1 is the lowest)
We'll explore these formulas by improving our breakfast spreadsheet.
SUM formula
=SUM(range)
Let's start by adding up the total number of ingredients required for each recipe. I'll use the SUM formula to add each value in the recipes and get a total amount.
There are three ways to use the basic formulas accessible via the top navigation:
Select a range, then click the formula (this will put the result either below or to the side of the range).
Select the result cell (i.e., the cell where you want the result to appear), then click on the formula you want to use from the toolbar. Finally, select the range of cells to perform your operation on.
Type the formula into the result cell (don't forget the = sign), then either manually type a range or select the range.
I'll demonstrate all three methods in a video tutorial here. First, I'll sum my ingredients by selecting a range and clicking SUM from the formula menu. Second, I'll select a result cell and highlight the range of cells that will sum together. Finally, I'll demonstrate typing a formula and range manually. When you're done selecting the cells that you want to add together, press Enter / return.
Now that there's a formula set up to sum all of the ingredients together, you can select the formula cell and drag the blue dot across the other cells to copy the formula to those cells.
COUNT formula
=COUNT(range)
Now that we know how many parts are needed for each recipe, I'd like to know how complicated it is to make. I've simplified this by assuming that fewer ingredients means that the recipe is less complicated.
In order to count the number of ingredients in each recipe, I'll use the COUNT formula. The COUNT formula essentially checks to see if the cells in a range are empty or not and returns the total that are filled. This formula will be set up in my spreadsheet the same way as my SUM row. Watch a tutorial here.
According to my spreadsheet, cereal is the least complicated breakfast, but I'm still not convinced that an easy breakfast is worth it. What if it costs too much? What if the extra effort of cooking another meal saves me money?
Now, I'm going to refine my decision by figuring out the average cost per serving of the breakfast choices by using the AVERAGE formula.
AVERAGE formula
=AVERAGE(range)
I've added some faux minimum and maximum prices per unit on my ingredients list to the right of my breakfast options. We'll want to get an average price for each ingredient using the low and high rates.
I'll start by highlighting the range of values (in this case, it's two side-by-side rather than a vertical range) and selecting the AVERAGE formula from the toolbar.
This will drop the result into the column to the right of the maximum price column. Next, I'll drag the formula down to apply it to the rest of the list. Watch how here.
I'll label my column "Average Unit Cost," so we know what we're looking at.
MIN formula
Let's say I wanted to determine what the cheapest price per unit is of the options. While you could easily just look at the chart and pick it out, this formula is very helpful for large data sets and will save you from scrolling endlessly. See how I use this formula here.
MAX formula
Similarly, if I wanted to determine what the most expensive price per unit is of the options, I would use the MAX formula. See how I use this formula here.
Was this article helpful?
That’s Great!
Thank you for your feedback
Sorry! We couldn't be helpful
Thank you for your feedback
Feedback sent
We appreciate your effort and will try to fix the article